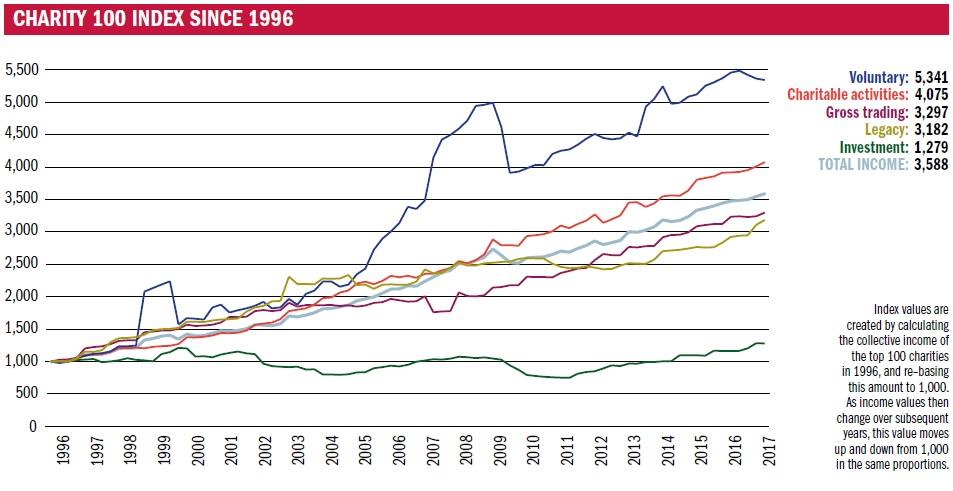
How are the Charity Finance Indexes compiled? Gareth Jones explains.
The Charity Finance 100 Index and 250 Index have been tracking income trends at the UK’s largest charities since 1996. The Charity Finance 100 Index tracks the largest 100 charities, while the Charity Finance 250 Index assesses the next 250. Index members are selected based on their average income over the last three years.
The income of members of the 100 Index ranged from £56.7m to more than £670m as of April 2016, while the minimum amount required for membership of the 250 Index was £20.6m.
Not every registered charity is eligible for inclusion. When the indexes were created, rules were set in order to focus on those charities which fit the more traditional public view of what a charity is. Housing associations, universities, academy schools and examination assessment bodies are all therefore excluded. Index members must also demonstrate a level of independence from government.
Income streams
Each charity’s total income is divided into five main streams – legacy, voluntary, charitable activities, investment and trading. Each of the five streams are tracked and updated every quarter to give an insight into their relative performance.
In order to maintain consistency with past data, these income classifications can differ to the current methodology laid out by the Charities SORP, although they remain broadly similar. Voluntary income tends to refer to income which has been provided without strict conditions for how it will be spent, while income for charitable activities includes grants provided for a specific activity, government contracts, and fees paid by charitable service users.
Trading refers to income generation activity away from charitable objectives, such as running charity shops.
Certain types of income are not recognised. They include gifts in kind or donated services that have been given a monetary valuation; and profits/losses from the sale of capital assets such as property or investments.
The investment sub-stream tracks dividends, interest, and rents from investment property. Although charities may also liquidate (ie sell) some of their investments to fund their activities, in accounting practice this is counted as a capital gain rather than income, so this is excluded from Index data.
Voluntary income anomalies
Over the life of the 100 Index, the voluntary income stream has seen a number of blips in its usual pattern of growth. Most, though not all, of these are due to data anomalies rather than widespread income trends.
The biggest blip was between 2007 and 2009. This was because the Children’s Investment Fund Foundation received a multi-billion endowment shortly after its creation.
There was a similar blip recorded between 1998 and 2000, when the PPP Foundation and the Diana, Princess of Wales Memorial Fund both joined and then left the Index following large but temporary influxes of funding.
A dip in voluntary income was also recorded in 2014, but this was a side effect of the Index's annual membership review, rather than a reflection of any widespread drop in income.
The same cannot be said of the period beginning in quarter 3 2016. At this time, voluntary income was hit by charities changing their fundraising practices following a series of scandals.

If you have any questions about the Charity Finance Indexes, please get in touch by emailing [email protected].


